|
||
|
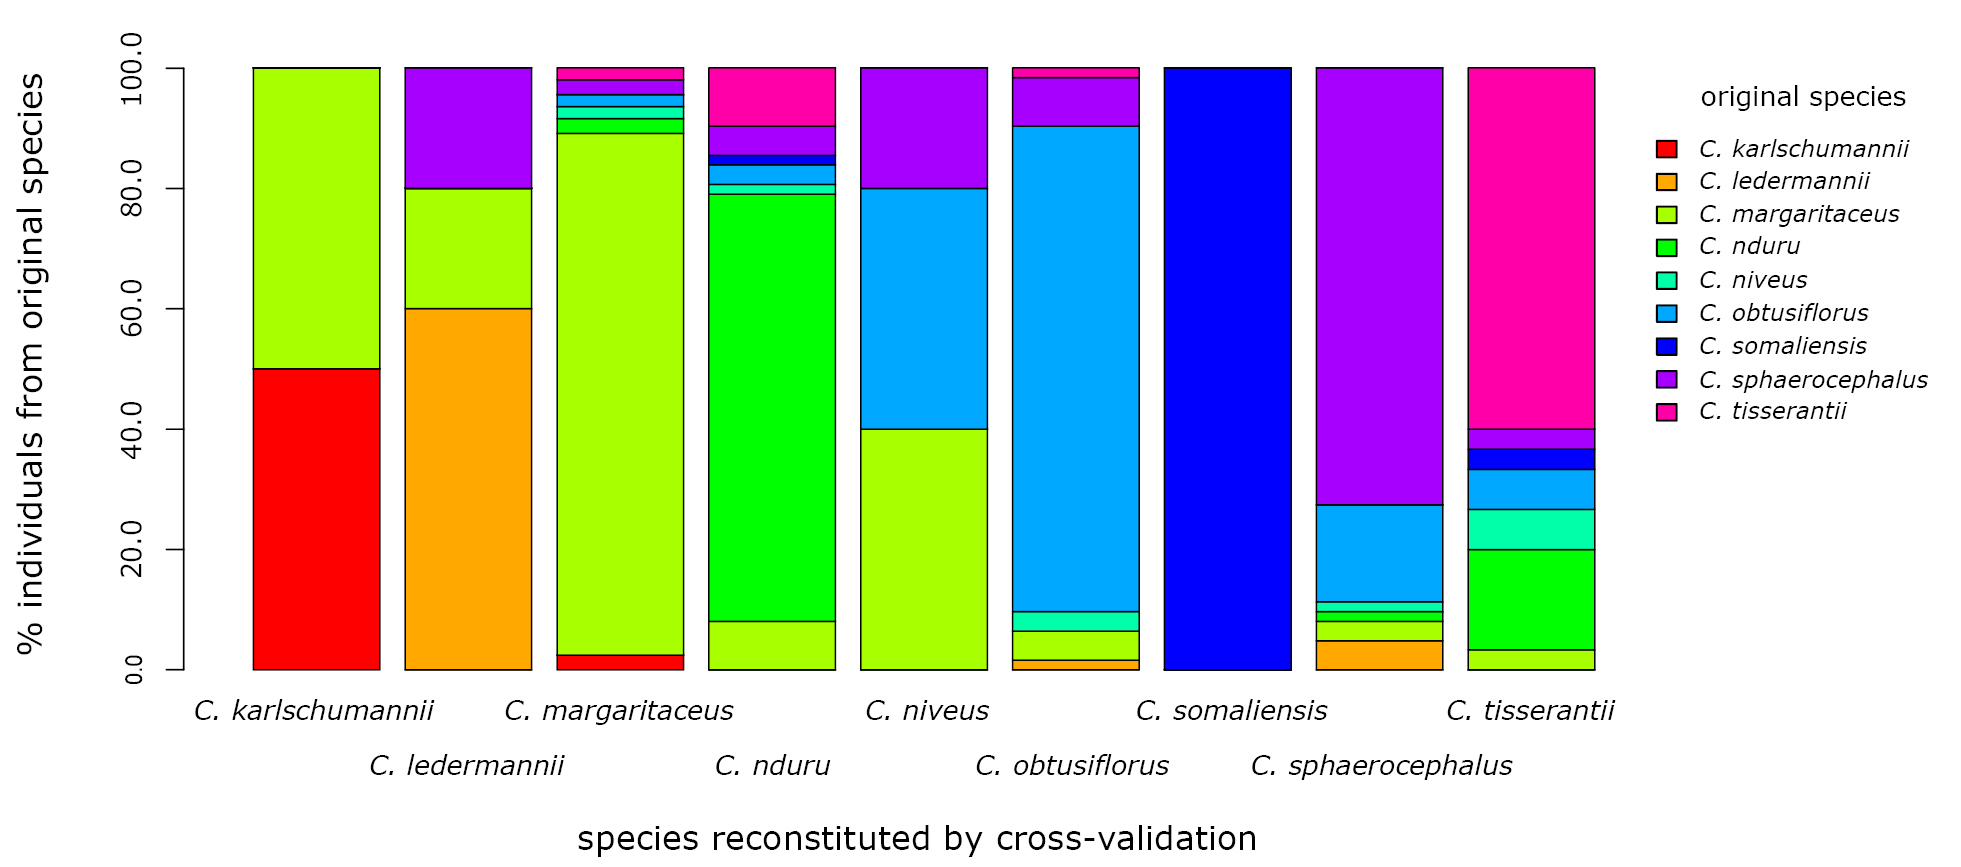
Bar plot representation of the cross-validation table for the LDA. Each bar represents the composition of one cross-validated group. The colours of species are shown in each bar as the proportion of originally determined individuals that make up that cross-validated group. |