|
||
|
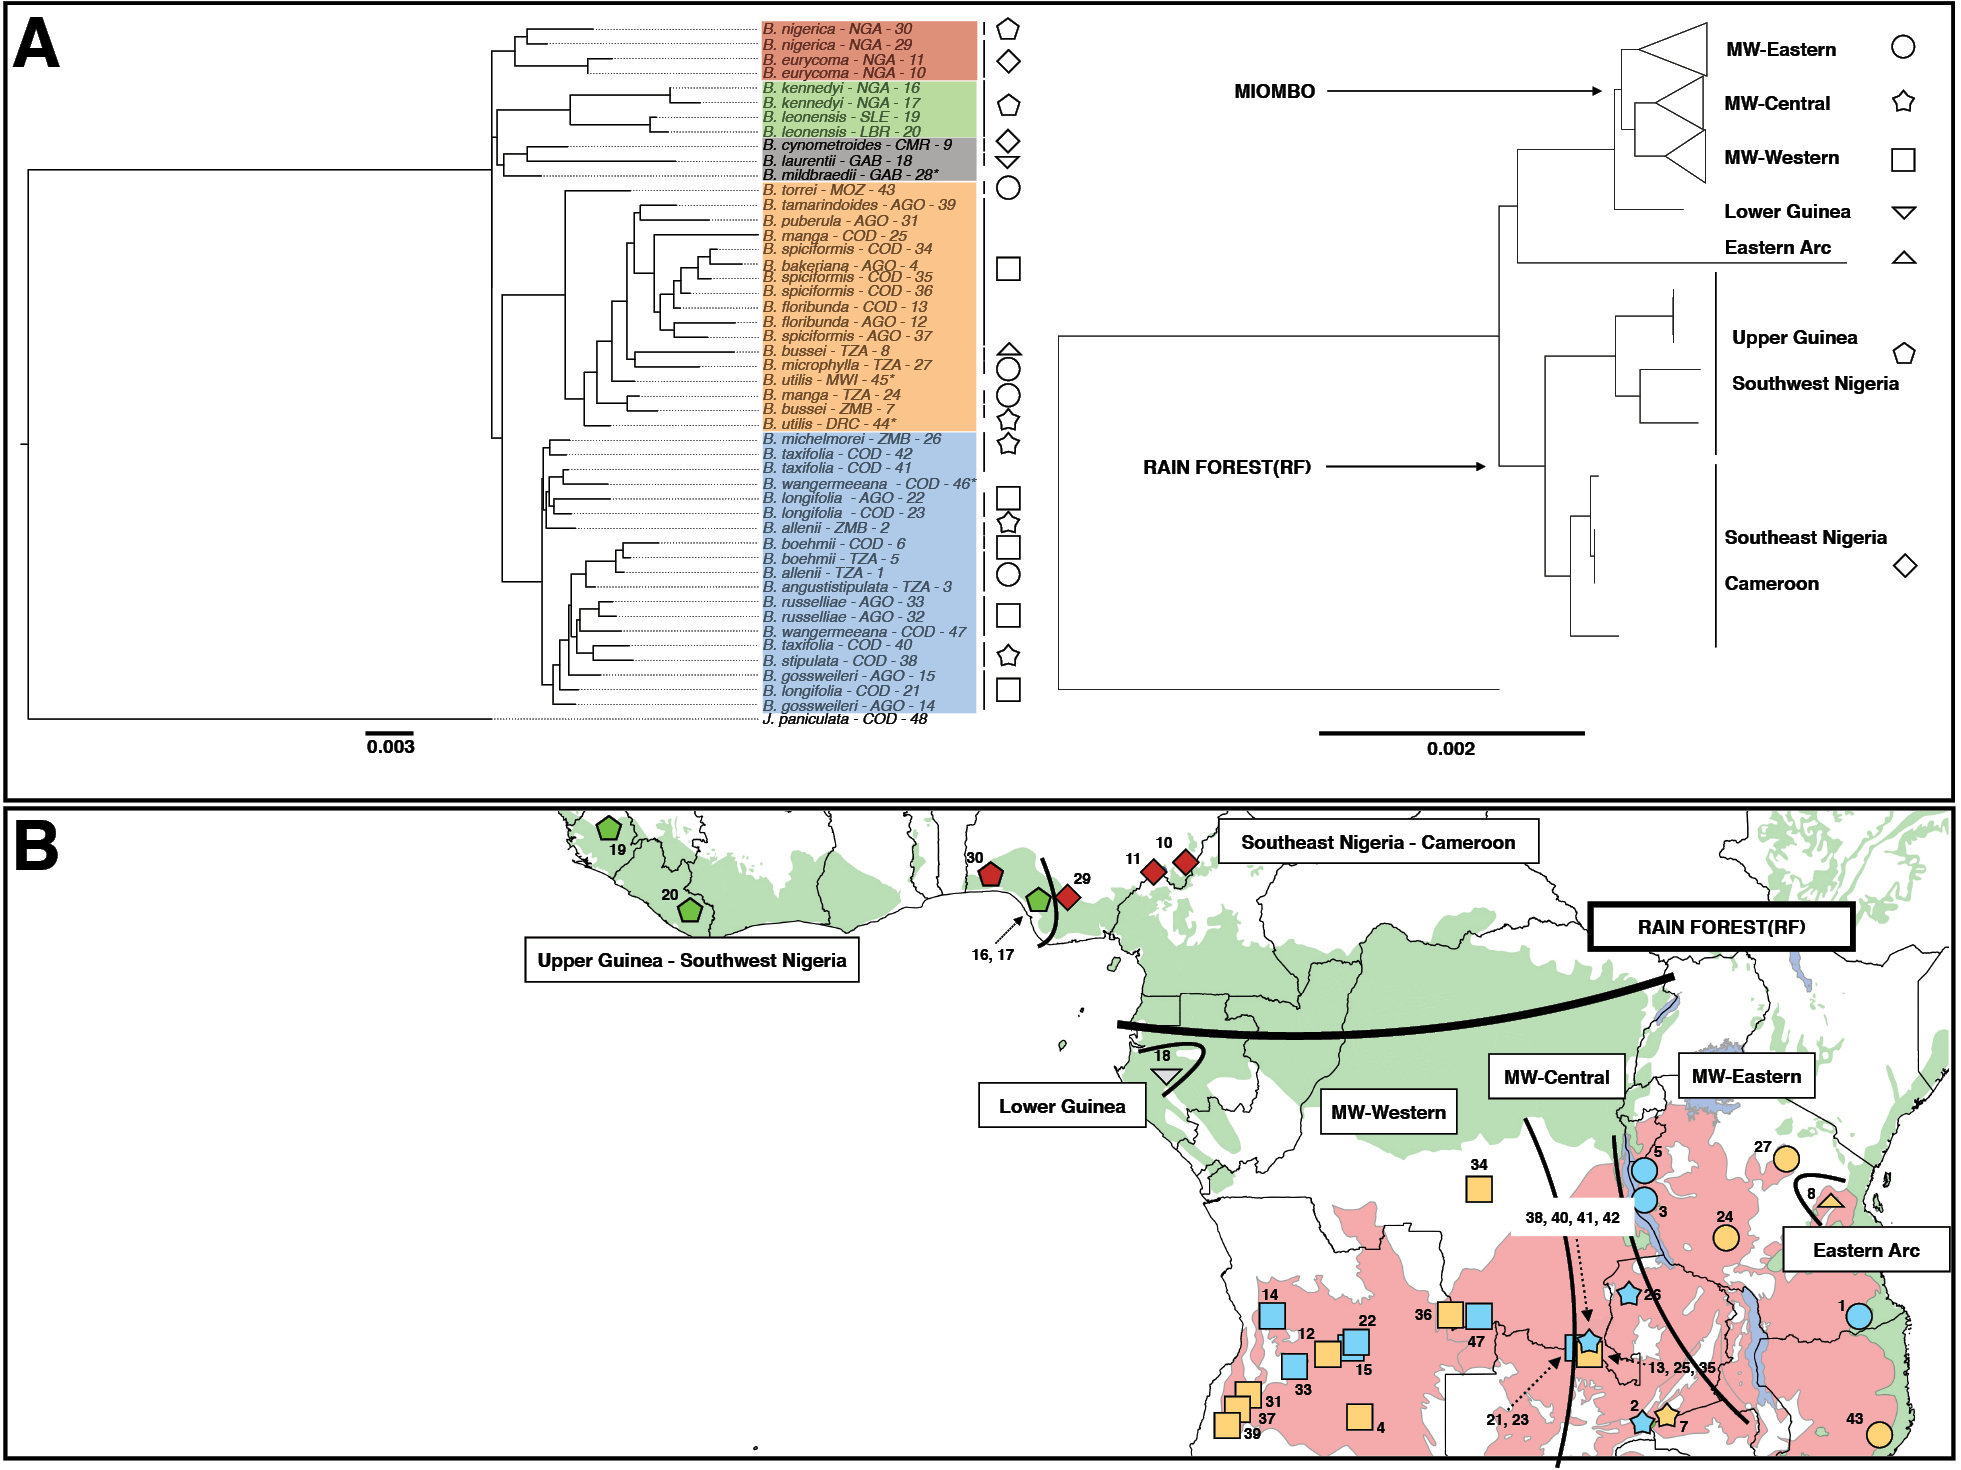
Comparison between the ribosomal (subfigure A, left; ML-I tree) and plastid (subfigure A, right) phylograms of Brachystegia specimens, together with the geographic distribution of the specimens (subfigure B) in the miombo woodlands (MW, in red) and the African tropical rain forests (RF, in green). Four specimens labelled with * are present in the rDNA phylogram but absent in the plastid tree. The plastid phylogeny delineates five geographically coherent clades and two additional singletons (each represented by different shapes in each subfigure), independently of the clades delineated by rDNA. Bootstraps supports are given in Fig. 1 for the rDNA phylogram and are above 98 for all branches of the plastid phylogram. |