|
||
|
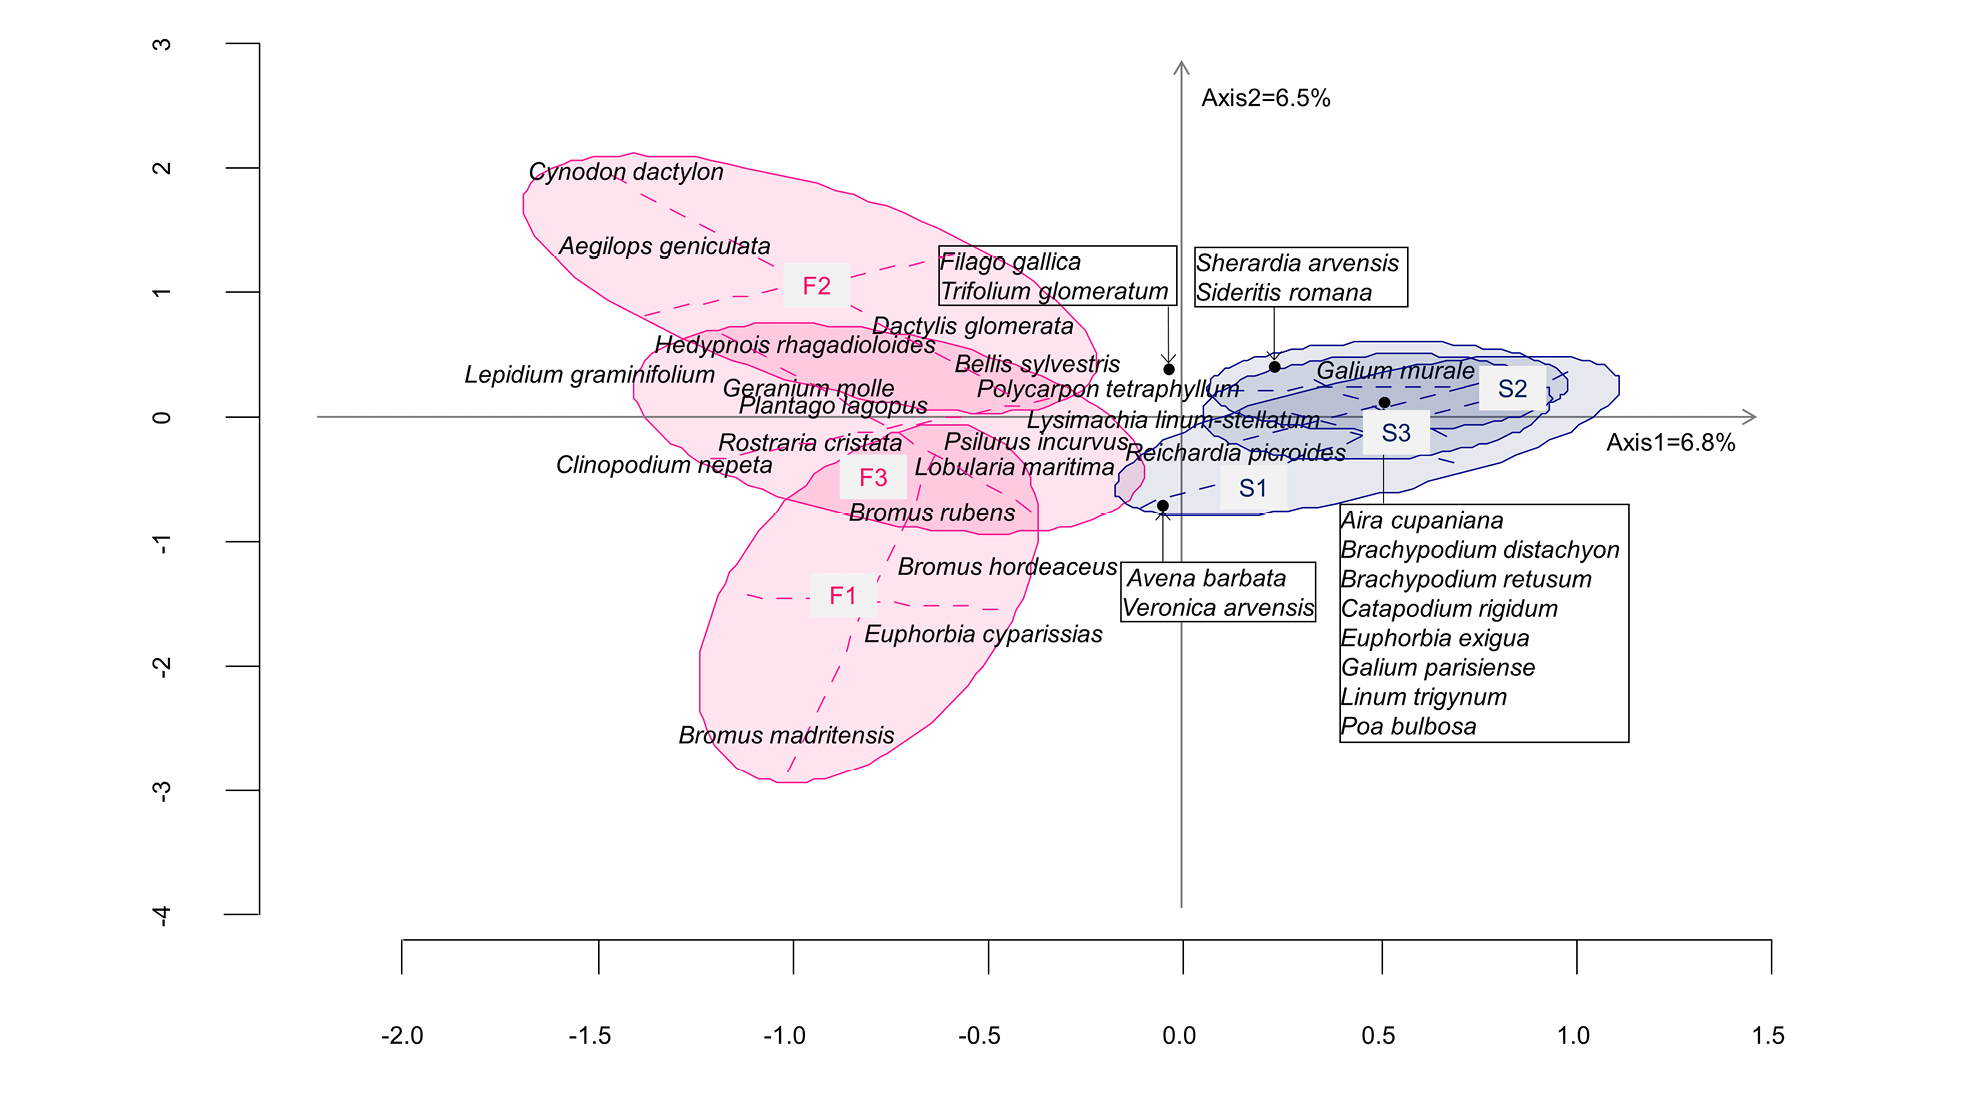
Correspondence analysis (CA) of species composition of the plant communities. S1, S2, and S3 correspond to native steppe plots (blue) and F1, F2, and F3 correspond to formerly-cultivated plots (pink). For each species, the total number of individuals was used for analysis. Species with less than 20 total individuals were not depicted. Final matrix: 144 quadrats × 80 species. |