|
||
|
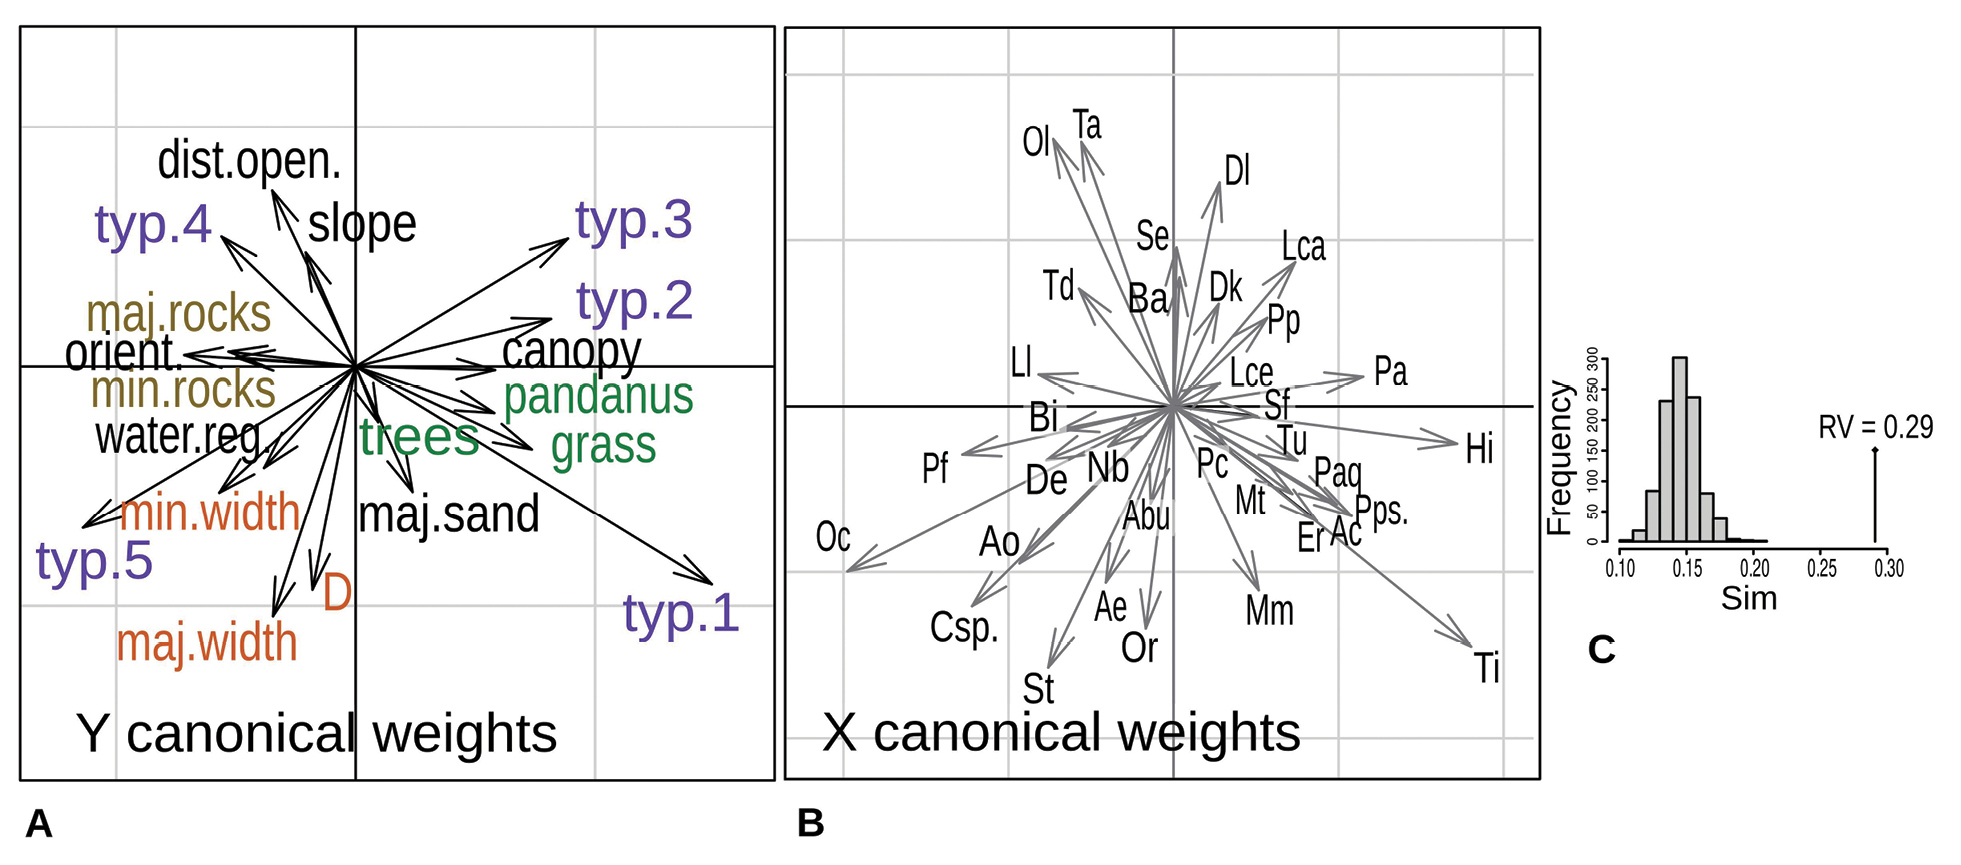
Co-inertia analysis. A. Scatter plot representing the coefficients of the combinations of the variables for ecological variables. The colours are only informative for easier reading: “green” = vegetation presence; “brown” = rocks; “orange” = riverbed dimensions; “violet” = Type of plot. B. Scatter plot representing the coefficients of the combinations of the variables for fern species abundance. C. Result of the permutation test; the RV coefficient appears as different that RV expected by chance. See Supplementary material 8 for plot position in the co-inertia. |