|
||
|
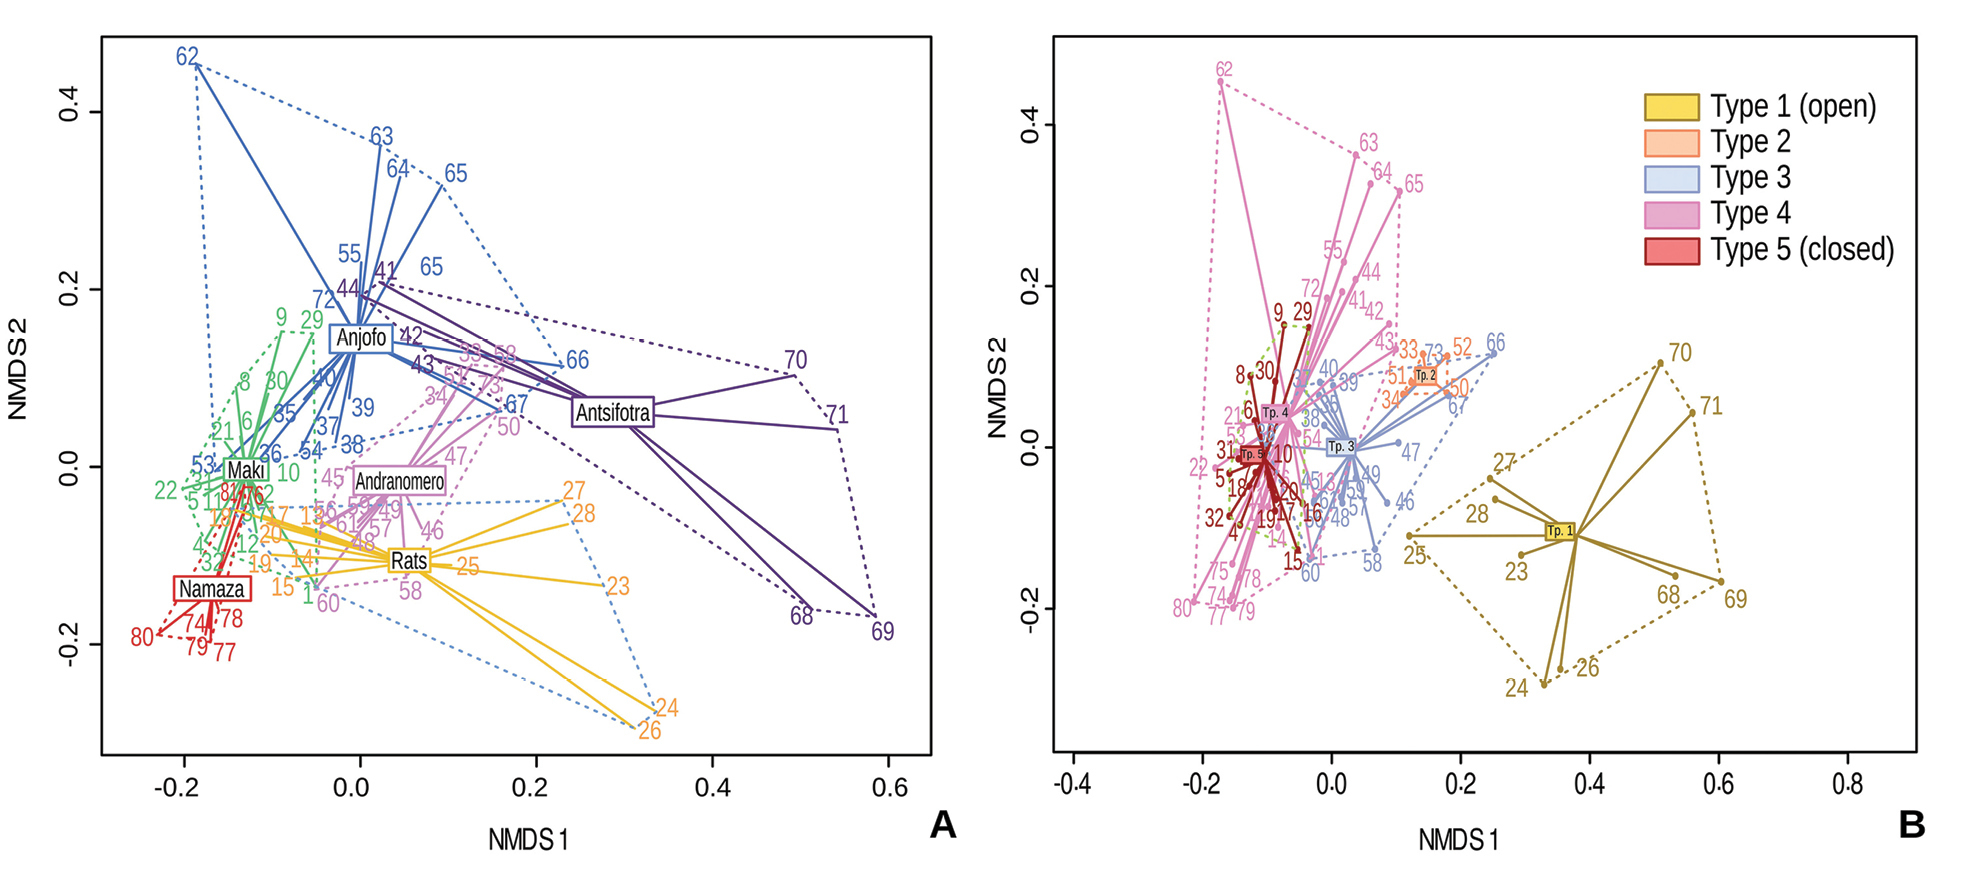
A. NMDS analysis according to the six canyons. B. NMDS analysis according the Type of plots. The horizontal x-axis represents the first dimension extracted by the NMDS analysis. This dimension is constructed so that the distance or dissimilarity between the points on this axis reflects as closely as possible the original dissimilarity between plots. In A coloured according to the canyons, in B coloured according to the Type of plot. The vertical axis is the second dimension extracted from the NMDS analysis, also designed to reflect the dissimilarity between the plots, but it is orthogonal to the x-axis, which means that it captures another source of dissimilarity relative to the x-axis. It is important to remember that the axes in an NMDS plot are used to visualise the relative similarity or dissimilarity of the objects analysed (here plots) in a reduced dimensional space, and have no direct meaning in terms of specific variables. |